|
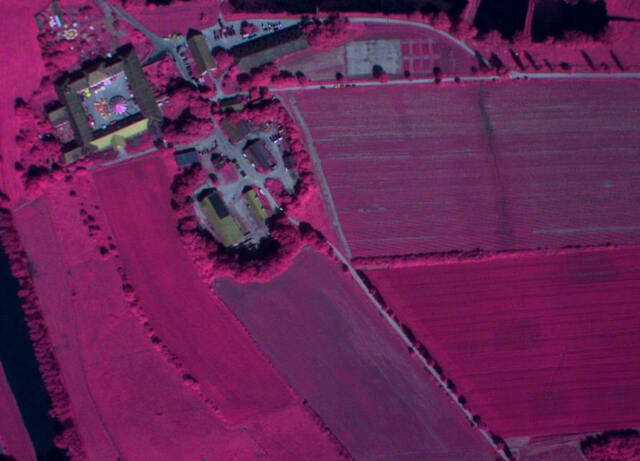
EXAMPLE
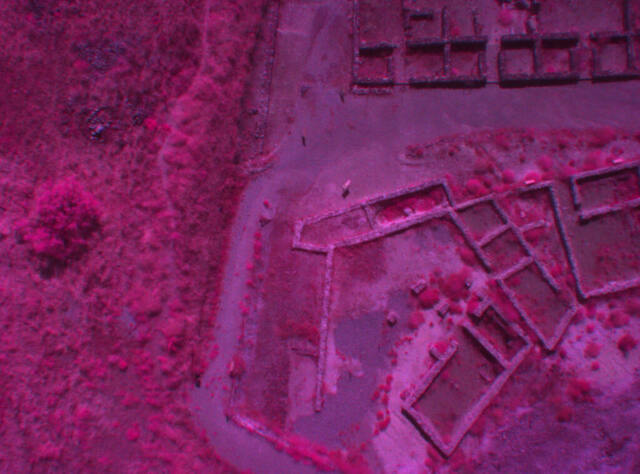
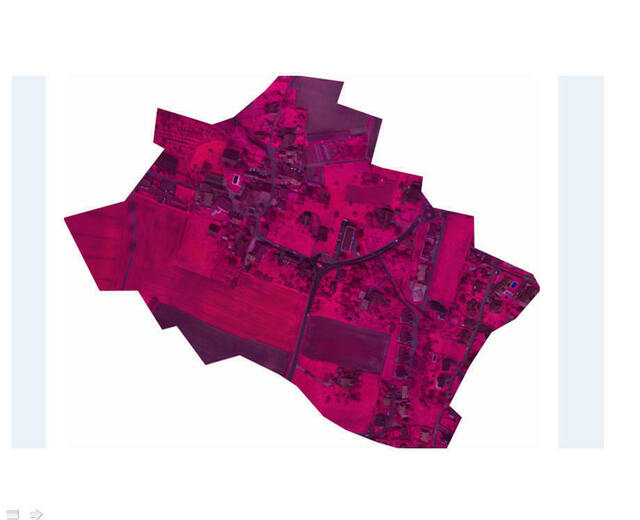
OF FALSE COLOR MULTI-SPECTRAL IMAGE
Why
do "false-color" multi-spectral images often appear rosy in
color?
Systems
in Tetracam's ADC family of multi-spectral cameras capture green
(520–600 nm), red (630–690 nm) and NIR (760–900 nm) bands in
high-resolution still images. In "false-color" images like
the one above, invisible NIR in the scene is converted to red in the
image. Green in the scene is converted to blue in the
image. And red in the scene is converted to green in the
image. Since healthy vegetation strongly reflects
near-infrared and also green radiation, everywhere that healthy
vegetation is present in the scene appears magenta (red + blue) in the
image. Buildings, roads and other areas where no vegetation
is present, reflect a full spectrum of visible and NIR solar
radiation but absorb much of this as well so they appear in shades of
gray (R+G+B) in the image. The rosy colored areas in a
multi-spectral image indicate the presence of healthy
vegetation. The higher the level of NIR, the more
photo-synthetically active the plant and the redder the plant appears
in the multi-spectral image.
What
is an NDVI image?
When plants are stressed, the level of the NIR radiation that they reflect
immediately drops. So, multi-spectral false color images provide very good early
warning signs of crop problems. The small color
variations that signal the onset of trouble, however, are difficult to
spot in a false color image. A Normalized Difference
Vegetation Index (NDVI) provides a graphical way to quantify small
changes in multi-spectral image color relationships. These
images consist of pixels with values determined by the formula, (NIR
-RED)/(NIR +RED). This formula compares the amount of
reflected NIR radiation with the amount of reflected red
radiation. Where healthy vegetation dominates the
scene, the NDVI formula approaches (NIR/NIR) or +1 in value.
Where there is an absence of NIR-reflecting vegetation, the NDVI value
approaches (-RED/+RED) or -1 in value.
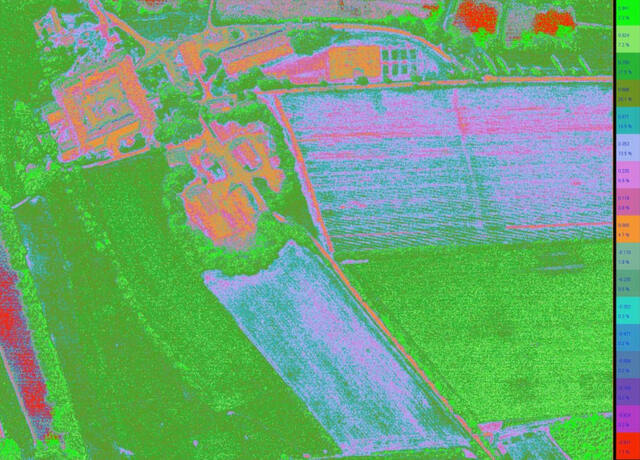
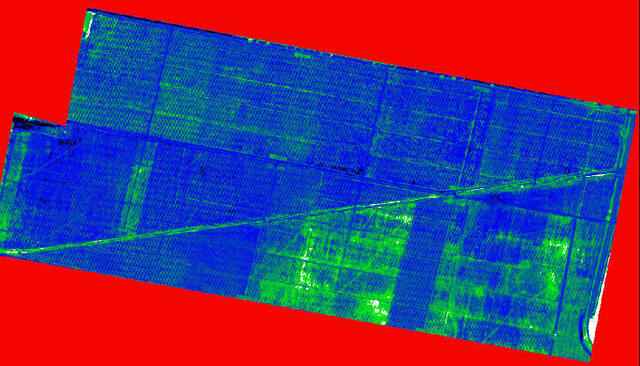
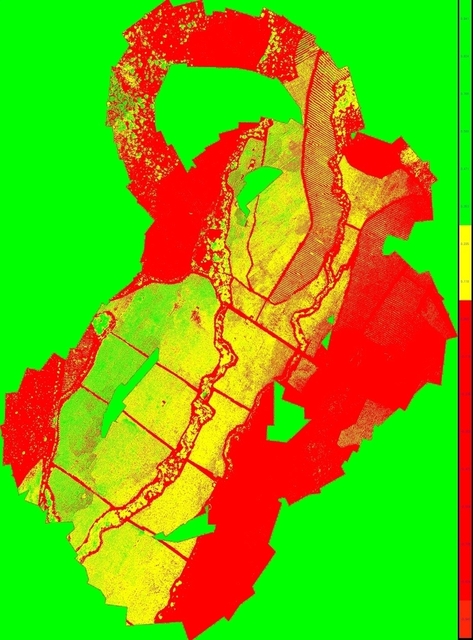
EXAMPLE OF NDVI IMAGE
PixelWrench2, the software that comes with all
Tetracam cameras, lets users derive NDVI and other graphical vegetation
indices from false color images. It allows users to provide a
color code for small changes in the values between +1 and -1.
It shows the colors in a legend to the right of the image.
And, in the same legend, it shows the percentage of each NDVI value
that is present in the image. So, if there is a change in
NDVI values between successive imaging sessions, changes in the legend
make the changing NDVI values easy to recognize and the color code
makes the location of the change in the scene easy to locate.
Growers can treat the individual failing plant rather than treat the
entire field, and they can begin to treat that plant long before it
gives any visible indication that anything is
wrong.
Are
multi-spectrum imaging systems limited to just monitoring green, red,
and near-infrared bands?
Since
the 1970's, broad portions of the green, red, and near-infrared sections
of the electromagnetic spectrum have been monitored by Landsat
satellites so there are a lot of historic images that show different
plant species in different areas of the world displayed in terms of
these bands. Tetracam's ADC family of cameras monitors red,
green and near-infrared using the same filter values used in Landsat
satellites. This allows systems in the ADC family to extract
vegetation indices such as NDVI comparable to those derived from
Landsat satellite images but there are many other bands of frequencies
that identify specific information about the imaged scene (see a
discussion on some of the most commonly-used bands
here).
Tetracam's
Micro-MCA systems may be configured with combinations of four, six or
twelve narrow-band optical filters of the user's choice that are within
the sensor's range of slightly under 450 nm to slightly over 1000
nm. Each selected filter produces a monochrome image that
shows the amount of radiation that the filter passes at each pixel
location in the image. The brighter the pixel, the more
radiation passed at the filtered frequency. As with ADC
images, Micro-MCA images may be stored in three native Tetracam file
formats; 8-bit RAW, 10-bit RAW or 10-bit DCM. It is necessary
to use PixelWrench2 to view Tetracam native file formats but this same
software can convert native file formats into standard formats such as
Bit-Map (BMP), Tagged Image File Format (TIFF), Windows
Meta-File (WMF), Portable Network Graphic (PNG) or a Joint Photographic
Expert Group image (JPEG) such as the one shown below.

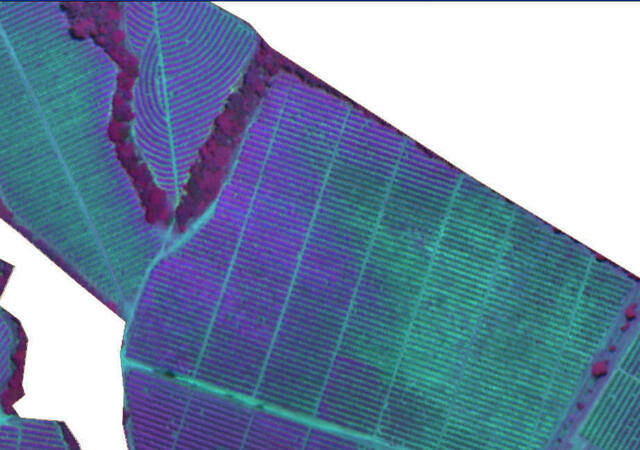
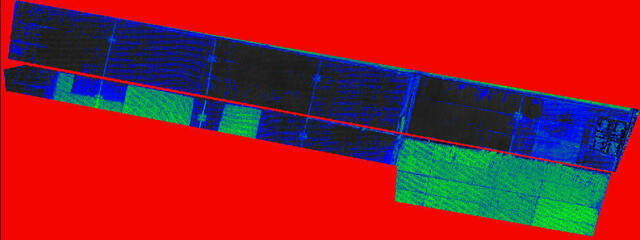
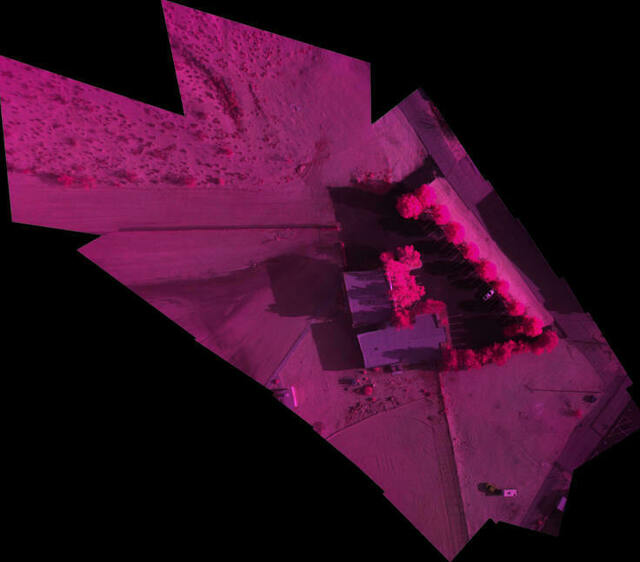
EXAMPLE
OF A MONOCHROME IMAGE CAPTURED BY A MINI-MCA6 (six of these, one for
each band, were captured at the same time and stored on six different
flash memory cards in a Mini-MCA6). PixelWrench2 was used to
convert one of the system's RAW images into jpeg format for display
here. In order to view the six
original images
of this scene in their native format, download PixelWrench2
from
this link then download
the files by clicking on each link below. View the downloaded
images by loading each using PixelWrench2. Each Micro-MCA
system is shipped with an MCA Global Alignment File. This
identifies information about the filters shipped with each
system. The Global Alignment File relevant to the images
shown below follows the file names.
TTC00083
TTC10083
TTC20083
TTC30083
TTC40083
TTC50083
MCA Global Alignment File
PixelWrench2
allows the Micro-MCA's multiple image files to be viewed one by one as
monochrome images or as composite color images or to be arranged as
perfectly-registered multi-page images. Users may scroll over
each pixel in a multi-page image to view a histogram showing the
distribution and amplitude of the frequencies that are present at that
location in the scene. These histograms provide an excellent
tool
for identifying unique spectral signatures of compounds, plant species
or specific plant conditions that are present at each
location.
How
are multi-spectral images affected by changes in ambient lighting
conditions and changes in the exposure settings of the camera itself?
Tetracam systems are
shipped with factory-set calibration values that relate the gain of
each filtered channel to one another given the transmittance of each
filter and the standard values of the sun's irradiance through the
Earth's atmosphere at the monitored frequencies. If ambient conditions
arise that
change these relationships, image inaccuracies may be corrected using a
teflon calibration tag shipped with each system. Capturing an
image of this tag under the prevailing conditions prior to each imaging
session enables PixelWrench2 to correct the relative gain of each
channel for local variations that would otherwise throw off image
accuracy.
The individual exposure
settings of the master camera in a Micro-MCA array may be set by users to deliver the best image
results under the available lighting conditions. If a user is
unsure of which exposure setting to use then
the system may be placed into auto-exposure mode. In this,
the system automatically calculates and adjusts exposure settings to
match the scene's mid-tone to the mid-tone of the master camera
image. Operating the Micro-MCA in auto-exposure mode evenly
brightens the image for best viewing of detail without changing the
relative brightness of individual bands with respect to one
another. Since the system's auto-exposure algorithm does not
change, it is consistently applied from one image to the
next. In most applications this enables users to accurately
identify, measure or assess the conditions that they are
investigating. Where absolute reflectance values
are required, users may purchase an incident light sensor for use with
their Micro-MCA.
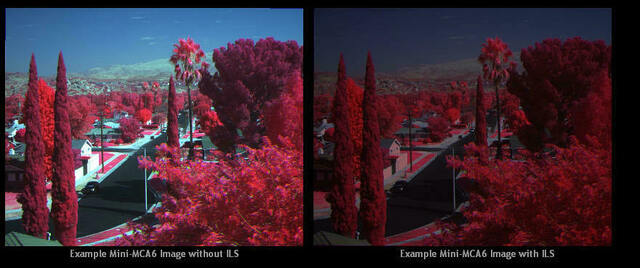
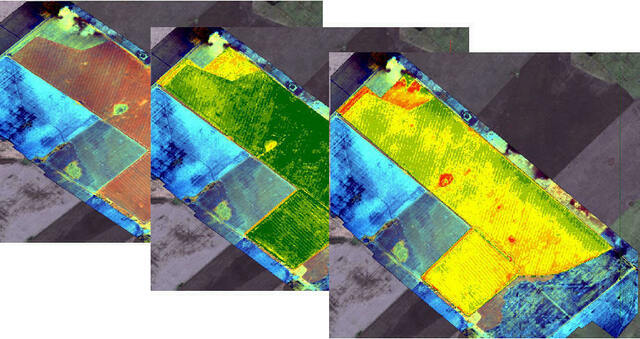
The
Incident Light Sensor returns absolute reflectance values by measuring
the amount of incident radiation that is down welling from the sun at
each of the monitored wavelengths and the portion of that incident
light that is reflected back to the camera at every pixel location in
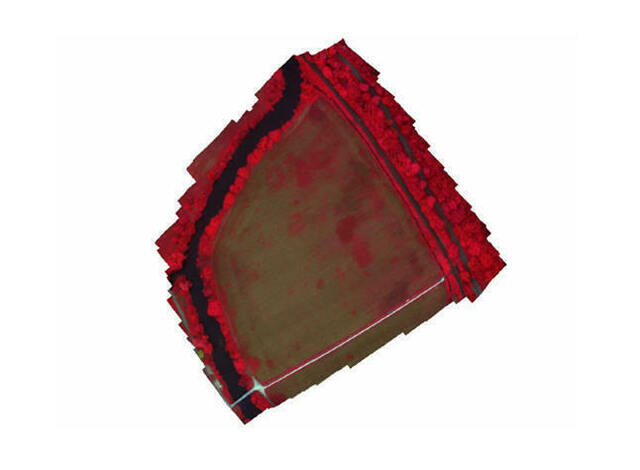
the image. Images
that represent absolute reflectance values typically appear darker than
those that are optimized to display best overall image exposure (see
sample images above). Check out
Tetracam's Incident Light Sensor for more information about
this Micro-MCA accessory.
|


